XVG/BTC @0.000112 . Verge . Price Analysis . 13-1-2018
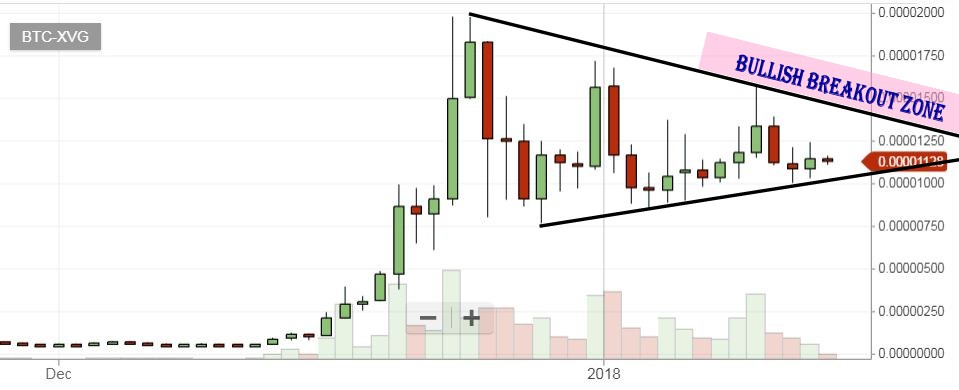
Check out the bullish triangle formed on daily chart of XVG/BTC.
The price will continue to surf between triangle lines. The triangle is bullish triangle because it is followed by a strong bullish wave.
If the upper trendline will be broken then we may see a new bullish wave, for a new all time high
Support: 0.00001 , 0.0000084 , 0.0000075
Resistance: 0.000015 , 0.0000175 , 0.00001995
Because this is a bullish pattern so the break and close above the upper trendline will give the market a bullish boost but break below the lower trendline will keep the market move uncertain and low volatile.
0.00001 - 0.000011 is best buying oppurtunity, Buying again Bitcoin and USD has almost some impact at the moment.
Disclaimer: This post is based on my own analysis and idea. this is not a trading advice
Thank-you
Congratulations @mohsee74! You have received a vote as a way to thank you for supporting my program.
Following you!
Congratulations @mohsee74! You have received a personal award!
Click on the badge to view your Board of Honor.
Do not miss the last post from @steemitboard:
Congratulations @mohsee74! You received a personal award!
You can view your badges on your Steem Board and compare to others on the Steem Ranking
Do not miss the last post from @steemitboard:
Vote for @Steemitboard as a witness to get one more award and increased upvotes!