Bitcoin (BTC) Evening Update: Linear and Logarithmic Charts Sitting on Same Support Zone

SUMMARY
Given Bitcoin's price progression thus far, It looks as if wave 5 of c of blue e wave has started. This means the $7,500 to $7,200 zone are the next potential stops. As stated in the mid-day update, there could be a spike down below the blue support line (blue circle) as it had in the prior wedge pattern (white circle).

The fractal wedge paterns are still holding to formation. The MACD of this 4 hour chart itself is also moving within a contracting set of boundaries. Is a crash scenario more likely or a breakout? I believe the latter; once the pattern is complete.

Here is the logarithmic chart showing the support fan lines. The top line is pretty similar to bottom triangle line of the larger degree of trend. Price is pretty much sitting on the top white line and this needs to hold as support. IF it is decisively breached, then the second line of support is projecting $3,800 to $4,200 or regions.

Legal Disclaimer: I am not a financial advisor nor is any content in this article presented as financial advice. The information provided in this blog post and any other posts that I make and any accompanying material is for informational purposes only. It should not be considered financial or investment advice of any kind. One should consult with a financial or investment professional to determine what may be best for your individual needs. Plain English: This is only my opinion, make of it what you wish. What does this mean? It means it's not advice nor recommendation to either buy or sell anything! It's only meant for use as informative or entertainment purposes.
Please consider reviewing these Tutorials on:
Elliott Wave Counting Tutorial #1
Elliott Wave Counting Tutorial #2
Elliott Wave Counting Tutorial #3
Laddering and Buy/Sell Setups.
Laddering Example with EOS
Tutorial on the use of Fibonacci & Elliott Waves
@haejin's Trading Nuggets
Essay: Is Technical Analysis a Quantum Event?
Follow me on Twitter for Real Time Alerts!!
Follow me on StockTwits for UpDates!!
--
--


Good detail on multiple timeframes. Thank you.
@HAEJIN - You Should Watch This Video
I didn't make it. I found it searching "Haejin Video" on BING.
Hey @haejin
Thanks for your great analysis.
Are you able to do TA on Drachma Coin next? Do you think it will go up?
It just started it's ICO. You can read about it here: https://steemit.com/greek-trail/@christosthegreek/the-drachma-coin-white-paper
This bear market has the potential to get people down.
But if you hang in there, keep your eyes peeled for opportunities, and just happen to be in the right place at the right time...sometimes you get lucky. Drachma Coin is one of those rare gifts.
I'm going all in on the ICO. Alllll Innnnn!
Ok so you're starting an ICO shitcoin. Then asking for TA on something that that has zero price data.
My my my, crypto has become retarded... :P
Edit: oh wait I'm the idiot... Hahah that's pretty hilarious. You got me :p
I tip my hat :D
@HAEJIN - You Should Watch This Video
I didn't make it. I found it searching "Haejin Video" on BING.
This level of support is extremely important.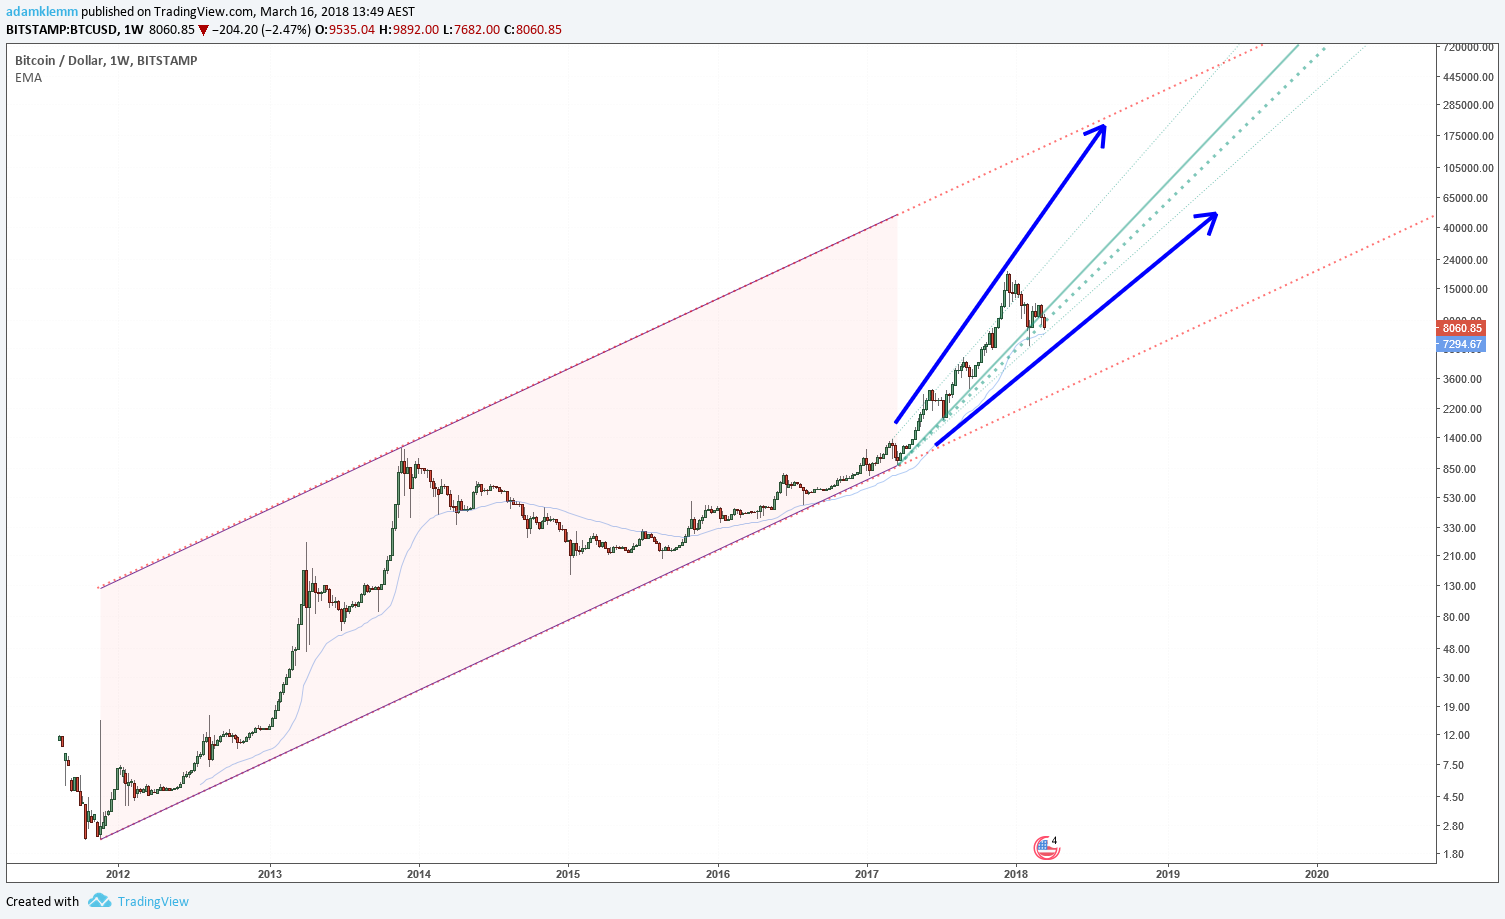
If lines are drawn under the price over the extreme long term, BTC still has some large upside potential.
Great post mr. haejin thank you!
Thank you, nice to see your update.
Nice! Please do COLX or ECA.
Thank you for giving us good information..... thanks a lot
It would be truth that Kobayashi (the japanese behind the Mt gox scandal) and his sellings are affecting the markets in this way? If this guy has this power, i do not want to imagine if one day Nakamoto move his millions of BTC hahaha.
Is there any source available to the rumor he will dump again?
Nakamoto is dead.
It is combination of FUD news and him timing his sell orders at right time when market was about to turn the other direction.
Can you please take a look at verge
@diverse why did you flag my comment on this post I am not able to speak my mind?