BTC TA the easy way – uncertain territory with imminent breakout
If we look at the Bitcoin chart on tradingview, particularly on the BTC/USDT Binance chart, we can see on the 4 hour time frame that price is on the verge of a breakout. A symmetrical triangle or wedge pattern has been forming over the past four days, with lower highs and higher lows. This tightening wedge is squeezing price into an ever smaller range, and as it approaches the point of the wedge. A breakout of this wedge is imminent. The question is which way, up or down?
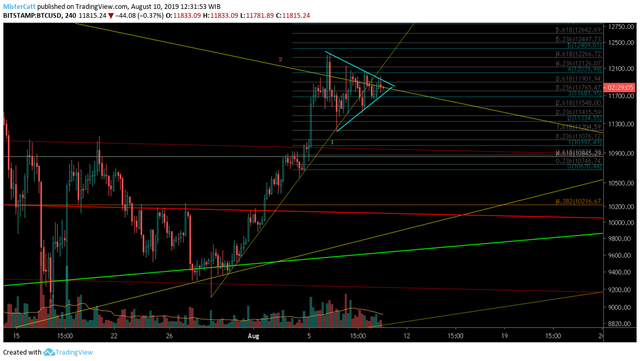
Since it’s an equally symmetrical wedge pattern, neither ascending or descending, the odds are even, if you’ll excuse the oxymoron. The chances are 50/50 up or down, on initial glance. Volume is also declining, which is another confirmation of an imminent breakout. Considering that price has generally been in an overall upward trend, I would like to remain optimistic and say the breakout will continue this upward price trend.
That being said, we need to consider that it is weekend and so volume usually drops now. It can, of course, make price easier to manipulate by some big whale. This is going on throughout Bitcoin’s history, with the volume generally fairly low compared to the other worldwide traded assets like gold or stocks. It’s an unfortunate part of the Bitcoin profile at present, though volume is expected to increase as more institutional investors start adding Bitcoin to their big funds.
With Bitcoin trading sideways like this, range bound, the 21 day Moving Average has flattened too, though the 50 and 100 day MA are still climbing. The RSI is also vacillating, though it has remained above the 50 halfway mark all of this month of August, now at 56, so there is more room for upside movement. 50 on the RSI is acting as support right now, despite the current downward trend since price reached a high of $12 300 four days ago, on 6 Aug.
The MACD is also on a downward trend since then, though with this sideways movement, it could be about to curl upward again. It hasn’t crossed over to bullish yet, though has remained above the average median line which is an overall bullish indicator.
On the daily chart we can see that price peaked around $14 000 after the past six months of parabolic bull run. It then made a lower high around $13 100 and another lower high four days ago at around $12 300. So the gaps between the highs are getting smaller. The one positive sign is that price recently made a double bottom of sorts on the daily chart, around $9 200 on the 17th and 28th of July. Price usually climbs after such a pattern, as it has, though the current rare sideways price movement is uncertain and hard to predict.
If price does fall, $9 200 remains a strong support. What an opportunity that would be – to pick up sub-$10k Bitcoin once more, perhaps for the last time ever. Even on the daily chart price is somewhat range bound and trading sideways in uncertain territory. Volume is decreasing, the RSI is range bound above sixty, which is bullish, though the RSI looks like its about to curl over, running out of momentum after the recent uptrend through all of August so far.
There is no denying that price has reached the top of a descending channel on the daily chart, since the recent high of $14 000, suggesting that there may be some downside action to come now. The 21 daily MA has already crossed below the 50 daily MA at the end of July, and is looking to move back up over it again, but may find some resistance there. If there is a breakout now and it’s to the upside, it would be extremely bullish, as it would mean breaking the downward trend of lower highs on the daily chart.
To conclude, I would not try to predict the direction just now, but will rather wait and observe, allowing the charts and price movement to show itself. We don’t want to miss out with all this current bull run activity this year, so it’s easy to FOMO in right now, which might not be a bad thing. Buy now and hope for the breakout to the upside. Particularly if you’re a long term hodler. The Bitcoin bull run is here, leaving the altcoins in the dust, so there is little other option beside Bitcoin to reliably invest in, so buy in while you can.

My hopes are for it to go down until this damn first pay day at my new job I've been waiting for, in the next 10 days, then I can buy some when there's a sudden mass panic down to 5k, it then can resume it's parabolic upward trend for as long as it wants 😀 that sounds realistic right? Based on my technical analysis sponsored by "hopium"
Posted using Partiko Android
Hahaha lol, many a true word said in jest. You may just get your wish there buddy.
Haha I know that as soon as I am going to buy, the price will tank so I will probably spread my spare cash over the course of the month to mitigate any sudden movements. 4 weekly amounts split evenly
Posted using Partiko Android
Well I really was joking but it seems that the price is tanking big time! Just a few more days now till magic Monday!
Posted using Partiko Android
Been looking at charts so much I'm seeing them in my dreams now. I want bitcoin to go down so that my alts will go up
I understand the logic, your holo token may be languishing there. As are all of our alts, incl steem.
Hey good to know you remember your dreams, that's excellent because dreams reveal a lot about the mind and the soul journey, if you can understand the symbolism in them. Keep dreaming. I certainly do.
Hi @julianhorack
Is there any chance I could DM you? Do you use telegram? or discord? I've some questions I wanted to ask you (outside blockchain).
Yours
Piotr
Yes Discord is fine. Same name there.
I like the waiting & observing approach 🙏
There's so much to learn 🙆
Posted using Partiko Android
Hi @julianhorack!
Your post was upvoted by @steem-ua, new Steem dApp, using UserAuthority for algorithmic post curation!
Your UA account score is currently 2.926 which ranks you at #11914 across all Steem accounts.
Your rank has dropped 3 places in the last three days (old rank 11911).
In our last Algorithmic Curation Round, consisting of 115 contributions, your post is ranked at #70.
Evaluation of your UA score:
Feel free to join our @steem-ua Discord server