BCHUSD - Technical Analysis November 12, 2017 - Current Price $1700

BCHUSD - Day Traders Chart Setup
Moving averages:
Green = 50dma
Red = 200dma
Orange = 9ema
Black = 20ema
Yesterday we did a quick chart on BTCUSD looking for a relief pop making note of the possibility that the price could slip all the way to $5500, which it has. BCHUSD has been on a tear this whole time as hash rate has migrated over too it and it.
If you would like to monitor this check out - https://fork.lol/pow/hashrate
In 6 hours, bitcoin cash difficulty will retarget, traders and investors should actually be watching to see what happens to the price as this occurs.
I want to chart Bcash today and discourage chasers. Its a token that's been on my radar for some time, I missed this move, but no harm no foul there are always other opportunities. Long story short - DON'T CHASE!
Our analysis for price thresholds in Bitcoin are as follows:
Bullish Above: $6268
Bearish Below: $6000
We will do the same for BCHUSD today.
I am using a day traders chart set up because of the price volatility which could make my longer term, swing trader setup deliver many false signals.
Daily
Still being relatively new there isn't a whole ton of chart data yet, but working with what we got, first we saw the price hit of $2500 and then sell off very hard, falling back down below $2000.
The price has gotten away from our pivot resistances and moving averages and consolidation/pullback should be expected to continue until the price normalizes.
The RSI is extremely overbought and the Stochastic RSI has been in extended uptrend for some time. On the daily time frame if the price must maintain previous weeks pivot r5 $1456 or it will fall back down to meet with the 9 and 20ema.

4 hour
On the 4 hour time frame we see the price actually wicked all the way down to the 20ema during the sell off, $1227. The price has yet to print a higher high on this time frame. We watch for the 9ema and 20ema to begin to curl down as the sotchastic RSI has entered a downtrend, causing the MACD to curl. The RSI is extremely overbought on this time frame. It makes taking a position here very risky and something only the skilled and risk tolerant may consider if they were to be looking for scalp opportunities using shorter period time frames like the 5 minute chart.

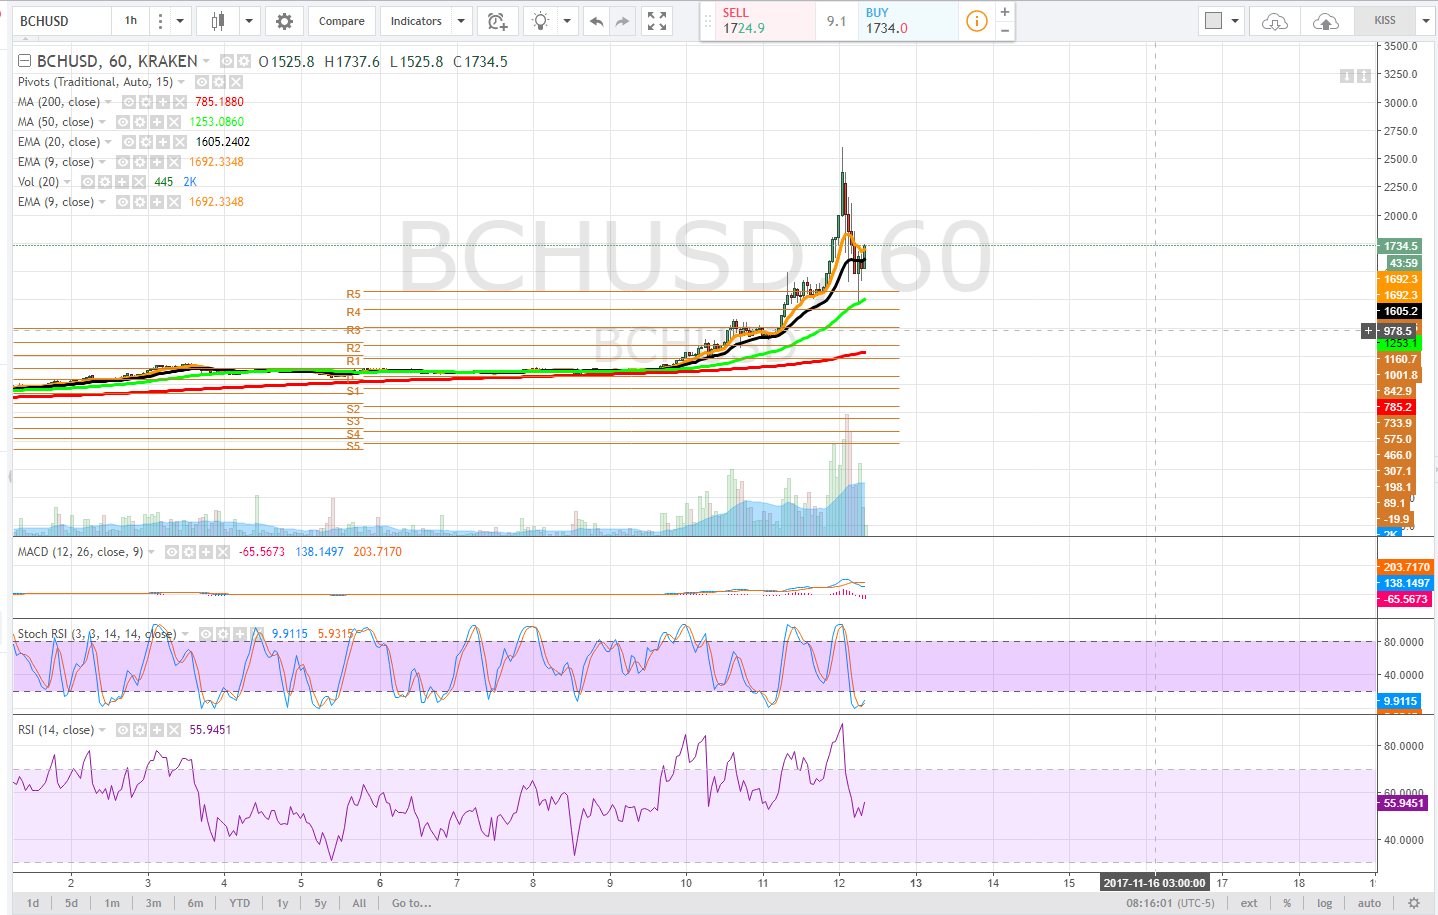
1 hour
On the 1 hour time frame the stochastic has cycled all the way into downtrend as the RSI broke down and the macd delivered a bear cross. The price did wick off of the 50dma and this tells us that that is an area of supply. Currently, the price is trying to push above the 9ema, and it is possible to see it enter range bound consolidation between the 9ema and 20ema.
If the price looses the 20ema a retrace of this move should be expected.
Bullish Above: $2100
Bearish Below: $1600
RISK TRADE: Do nothing, we missed the move. If price reclaims $2100 on volume and is confirmed by a follow-up candle on the 1 hour time frame, maintain a bullish bias, cautiously so, use stops to limit risk. Conversely, if the price loses the 20ema on the 1 hour time frame, expect the pullback to deepen.
Don't forget to use stop losses!!!
Previous Articles:
BTCUSD
ETHUSD
BTCUSD
BCHUSD
ZECUSD
LTCUSD
BTCUSD
ETHUSD
Follow at your own risk, Not a financial adviser, understand the risks associated with trading and investing. Manage your own Risk - in other words you could lose it all and it's your own fault.

A little off topic. Using BotFinance's Tradingview platform for my TA. I'm used to being able to put up a Avg. Volume indicator that helps me determine if a move was really significant or not. I hoped you would have some info.
Also I've traded stocks and FX for a while and TA seems to work well enough for the most part. But do you ever feel that using TA for the cryptocurrencies doesn't really correlate as well? Would like another viewpoint from a fellow trader
Absolutely technical analysis works, the RSI is a solid indicator once it corrects from either direction and RSI trends can be quite a useful tool. The price volatility can skew the chart reads quite often and this is where the RSI is a great tool. I prefer to use moving averages and momentum. I have another chart setup for trying to glean information on longer term swing setups.
I'm using RSI, MACD, EMA's as well as my more bread and butter price action with corresponding volume moves as my main trading setup.
I'm not saying it doesn't work but it doesn't seem to respect the TA's as well as the other securities did. At least from my novice experience so far. For example, large volume movements, price would normally respect these support and resistances but with the cryptos they seem to move right past without even the hint of volume behind them. Have you noticed a difference?
And perhaps maybe it's just because of the last 48 wacky hours that things are not necessarily correlating as well with TA's but rather news and unpredictable forces?
In some cases yes, extreme volatility ignores gravity -- when they ignore gravity wait for topping and bottoming -- use RSI - but for sure, sometimes they defy chart logic - this is because we have limited supply and a lot of investors and traders who are novice and may or may not understand risk - BCH is perfect example, went parabolic, from 1200 to 2700 late last night in just a few hours - no person in their right mind would chase that. Those that did are bag holders.
Agreed. I was watching that and just thinking, when is this thing gonna come crashing down? I kept wanting to go short but was amazed at the momentum and even cynicism of those buying!!!
Absolutely agree.
Quick example, ETHBTC short entry -- gap resistance, could produce a top. Price needs to remain above 200dma, red to stay bullish, also mus break above gap resistance. Note slight uptrend on RSI, note is has tested the trend quite a few times, expect it to test again. If no position wait for price to fall below 200dma, this will pull the stochastic RI into downtrend - my view of course.
I see a possible ascending triangle with the rsi also confirming the upward trend. All I would need to commit is a higher than average close above that trend line you have drawn
and alternatively you would play the opposite way if ETH pushes up into the gap and the 50dma (green) goes above 200dma (red) -- this is 5 min time frame, looking for a scalp.
That large spike in BCH where it touches the high point was pretty insane. Would love to know if anyone knows why that happened
I actaully had an open long trade at the time. It jumped up to over $2,700 very suddenly (on plus500) then back below $1,700 within 15 minutes.
I managed to close the trade while the price was dropping off the peak with around $90 profit. Selling at the top would have made close to $700.... anyway can't trade in the rear view mirror so I'm still happy to close a trade in the green :)
Still smart to lock it in. Volatility can often denote trend shift --- price fell cause demand did, volume climaxed on the 1 hour time frame at that point.
Ah so a very large buy must have spiked it up. Feel sorry for whoever paid those prices :)
I thought market depth must have been thin to let the price move so much so fast in both directions
It was a reversal sign, and I have since gone long regular BTC hoping that the price will start moving when Asia wakes up in a few hours and starts their trading week.
There are all kind of tactics that can be used to manipulate or drive if one has the capital to do it - not saying BCH was entirely manipulated, was exuberance as much as anything.
Buying above ask, selling below bid, spoofing, etc. all can make price defy gravity in either direction
Great analysis. My current strat is stop losses. Im gonna wait out this "cryptocurrency civil war" till it gets stable. I dont necessarily trust BCH but I have converted some of my BTC, the gains are plentiful but probably not for the long run. Post like yours will help me monitor the current market. Thanks.
Makes me pleased to hear! Glad you find it useful! Good luck! Also love to hear that stop losses are part of your strtegy, risk management and capital preservation are everything.
I'm not married to my coins, and gives me better sleep when I know my money is not going to the drain quickly lol. Thanks again. Ill follow you, I'm kind of new hear so thanks :)
Bitcoin cash is a huge pump & dump scheme. I would suggest to get out of that evil nest asap.
Right now BCH looks good but for long term i dont think it worth to invest.
opposite in my opinion, right now it looks extended, parabolic rally may be met with equal and opposite, but chasers gonna chase.
You are right, right now BCH is pretty overrated...
I was hoping BTC will hit $10,000 by the end of 2017, now that BCH came into the scene it is getting more interesting, i was profiting from BTC so i took a portion of it and invested in BCH, as they say don't put all of your eggs in a single basket :)
diversifying is key and its not like they can't - co-exist, market will have to find that happy medium.
Well good work keep sharing :)
good information
cool