BTC - 2018 10 12 - all according to plan
The good news is that BTC is following the plan nicely with no unexpected surprises
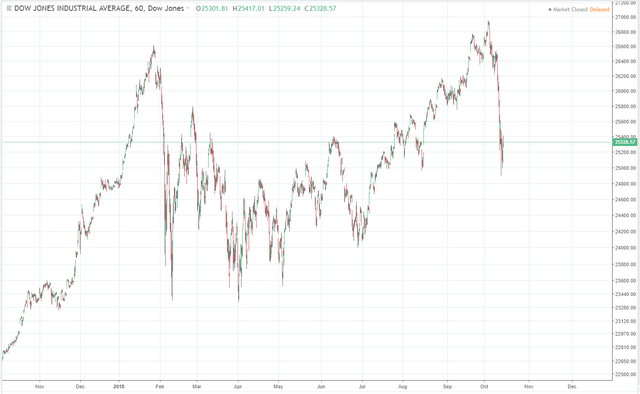
The Dow took a pretty decent dip this week, prompting an expected drop in the crypto markets.
I hope you were expecting a drop in the crypto markets, you certainly should have been as I have been blogging about it coming for some time now, including in my most recent BTC post: https://mentormarket.io/cryptocurrency/@bitbrain/the-long-term-bitcoin-pattern-repeat-again-latest-update.
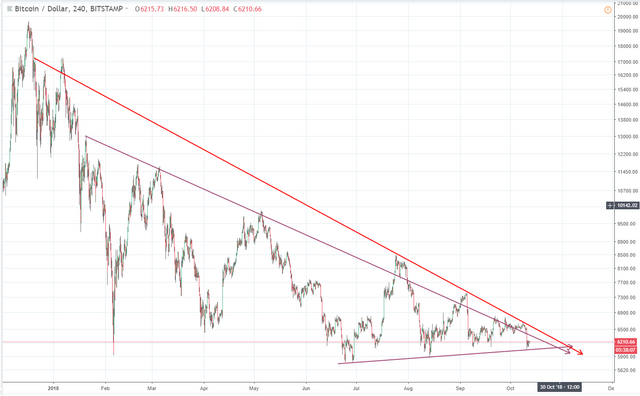
Several months ago I wrote about how crypto markets were splitting away from traditional market indicators, specifically the Dow. This still holds true and you can read the whole post here if you like: https://mentormarket.io/cryptocurrency/@bitbrain/a-troubled-relationship-crypto-divorces-dow. However, a large market shift will still have an affect on crypto. When it is times like this one was: when crypto should drop, then the result will be that crypto does indeed drop. But the "splitting away" still holds true because while the Dow took a large dip, the dip in crypto was comparatively small. The crypto dip was in keeping with the possible scenarios I predicted back on 8 October: https://mentormarket.io/cryptocurrency/@bitbrain/bitcoin-8-october. In fact, if I use BitFinex charts, the latest dip maintained the trend of higher lows and is similar to the best case scenario from that post:
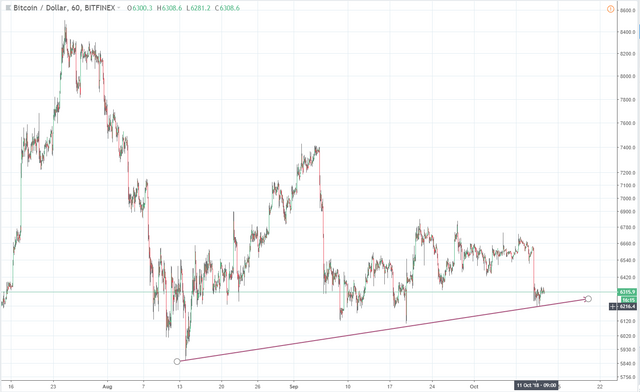
BTC - 2018 10 12 - all according to plan
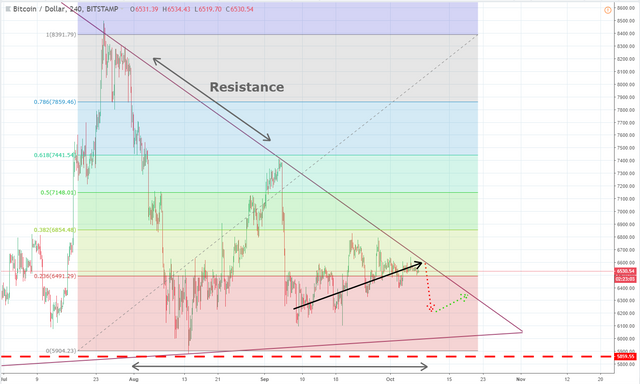
We now have data to further refine our charts, with the latest possibilities looking like this:
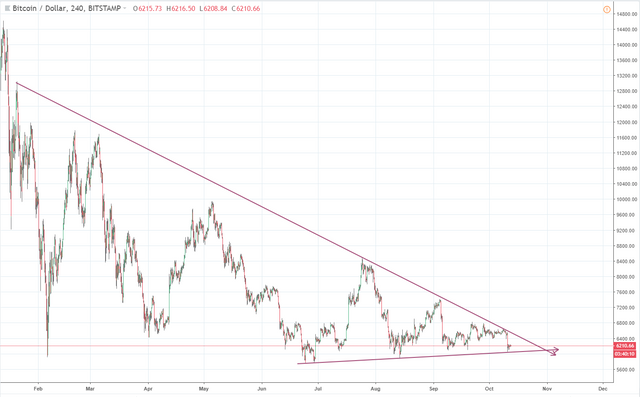
The linear chart below shows the latest highs lining up with the first upwards correction in early January. This is probably purely coincidental. That line was bound to line up with something from December/January.
This chart below is interesting, the linear chart line (in black) now intersects various price peaks on this logarithmic chart. The logarithmic chart line is shown in red. Interestingly, the support line at the bottom changes so little between linear and logarithmic that it is not necessary to create a new one. This is probably because it is almost horizontal.
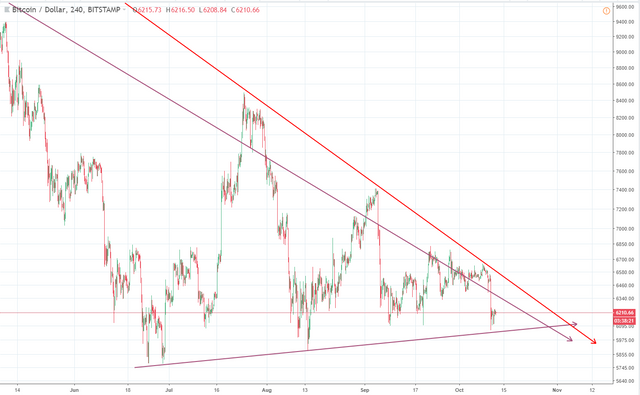
Extending the logarithmic resistance line further into the past reveals that it does not tie in with any specific peaks in December/January. But as I have said before, I don't trust what happened back then and I believe that most of that price data should be excluded from TA.
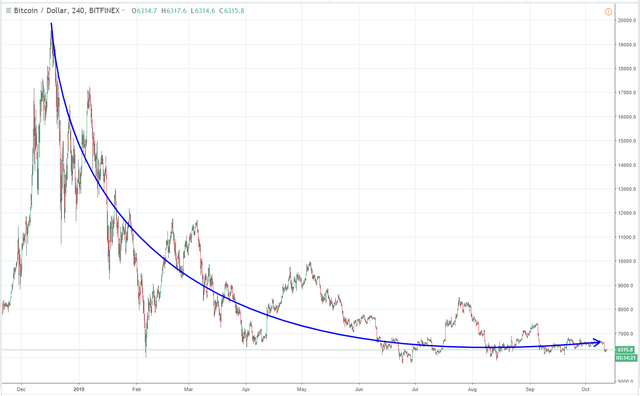
As the year goes on it becomes increasingly important to use logarithmic charts rather than linear ones. Logarithmic works far better over time and is far less susceptible to distortion. But it doesn't fix everything. The way I see it, this price movement in the market, (the rapid descent from $20 000 BTC that Started around 10 months ago) is now so old that it needs to be looked at with curved lines instead of straight ones. Curved lines seem to fit the price movement better. They also occur naturally in inflationary markets (especially when you fail to use log charts). I think that this chart below is a far more useful indication of average BTC price movement for the year than any straight line chart that you may have seen. It's pretty self-explanatory and it works for linear charts like this...
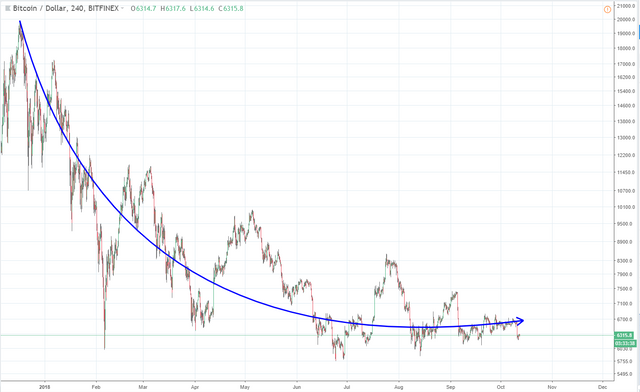
As well as for logarithmic charts as shown below. If you have sharp eyes then you may have noticed that the far right side of each curve is already curving upwards! You don't have to be rocket scientists to know what that means! Just put you ears to the ground and hear the sound of a herd of bulls galloping towards us...
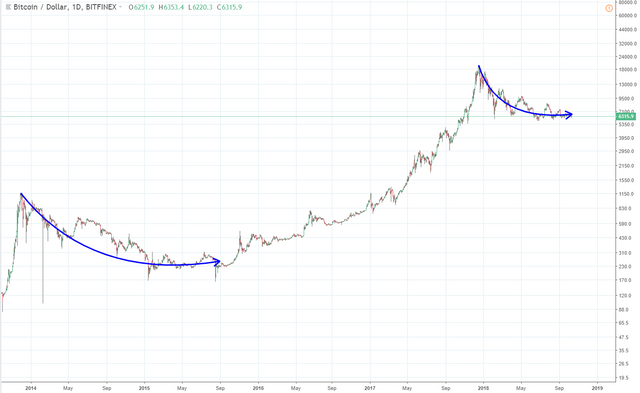
Seen in the bigger picture, you can see that the curves also make sense when compared to the previous (even bigger) major bull market for BTC. Check this post to see how scaling is important between these two markets, and how the relative sizes of the curves make sense in that context.
Lastly, and this is merely for reference, here is a Dow chart. Note the similarities with BTC nearer the start of the year, and how different they are now. Also note how much the Dow dropped now, and how little BTC did (relative to other price movement this year).
Yours in crypto,
Bit Brain

Bit Brain recommends:
Crypto Exchanges:


Published on

by Bit Brain

Awesome TA. Does this chart have any significance to you? If bitcoin halfs by mid next year, could it go down to 2 or 4 k first? Or maybe we will see it go to 100k before shedding 80%!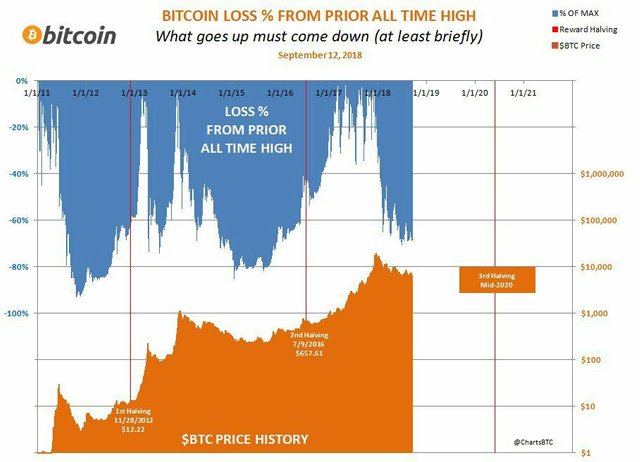
I don't see any chance of going down to 2 or 4k. As the loss section of your chart shows, the loss is busy rounding and preparing to decrease again i.e. - that pitter-patter of little bull feet approaches. Your 100k may not be too far away... It should be several years before we see such a severe bear market again. The real interesting performance will lie in the altcoins. Choose your alts wisely and wait.
Interesting the DOW chart... it is a global recession indeed... and BTC seems to keep its strength much better
Yes. Whether they will admit it openly or not, investors can already feel the intrinsic value and safety of BTC. "Digital gold" in every sense of the term.
That is a VERY interesting line to look at. Thank you for sharing @bitbrain 😄
Posted using Partiko Android
Nice one @bitbrain
I think we're accumulating in preparation for the next market cycle, Bakkt, Liquid Network, Driving Chain, Bitcoin will lead the next market cycle I reckon.
One nitpick here though:
I don't think those curves you drew on the log chart mean anything and they can easily be drawn to make the market look very bearish.
Like that:
I remember there was a guy on twitter early 2018 who kept drawing bullish curves like these on bitcoin, maintaining the parabolic move to 20k was still intact, he's gone mostly quiet now.
While I agree BTC has run into accumulation, I believe it's for the fundamental reasons I've listed above and not for technical reasons, the technical only support an assumption regarding the fundamentals of the technology.
Sorry for the rant,
Cheers!