TIB: Today I Bought (and Sold) - An Investors Journal #307 - Gold Mining, Italy Telecom, Cloud Computing, US Retail, Marijuana
What did you do during the selloff? Nothing for 13 days. I waited for buying opportunity when markets showed signs of life on earnings data and I banked some profits. No panic here.

Portfolio News
Market Selloff
Market jitters turned into a selloff last week.
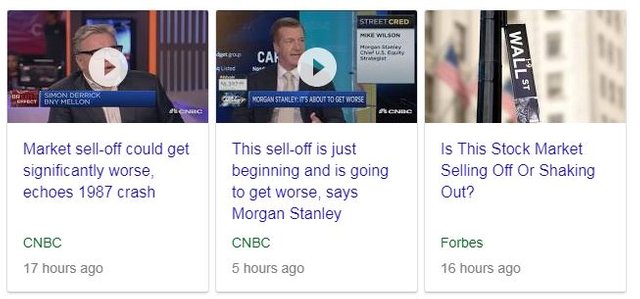
Which headline to follow?
My sense it was a case of nerves in the absence of data. Nerves that got frayed by China trade rhetoric, the Saudi Arabia event, Federal Reserve bashing, rising interest rates, you name it. Yes we are heading towards the end of the cycle in the US. We do not know when the cycle actually ends until after it has ended. Expect more volatility is all I can say but I am looking hard at the GDP and inflation numbers - they do not lie.
This article lines up what I was thinking. He asks what changed during last week - nothing is his (and my) view
https://www.forbes.com/sites/johntobey/2018/10/16/is-this-stock-market-selling-off-or-shaking-out/
Bought
The selloff last week has prompted the talking heads to focus on hedging trades. Gold price has been moving in response to the selloff. The buy:sell chart between S&P500 and Gold shows how Gold has started to outperform since the selloff. It might be better to see the chart make a lower low before making a trade BUT this is time for hedging. Jim Cramer keeps muttering under his breath "End of Cycle". I plumbed for gold mining stocks.
Yamana Gold (AUY and RNY.DE): Gold Producer. A Real Vision guest, Greg Weldon, has been talking about gold. He likes mining and talked about a chart set up, which he did not show, that shows price testing a key Fibonacci level several times. I found this stock with price testing a 0.786 Fibonacci level 7 times. That tells us exactly where the buyers are.
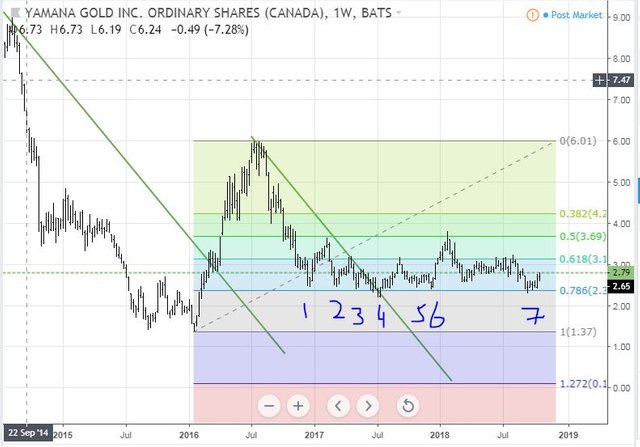
Yamana operates gold mines throughout the Americas including Canada. I picked this company rather than Barrick Gold (ABX) because the chart is showing that bottoming effect Weldon talked about. Barrick is not. I bought shares listed in Frankfurt and in New York. Frankfurt listed shares offer a Euro hedge as earnings are in US Dollars but shares paid in Euros.
I also bought a January 2021 2.5/4 bull call spread for a net premium of $0.47 (18.8% of strike). The bought leg is $0.15 in-the-money. This offers a 219% maximum profit potential. Let's look at the chart which shows the bought call (2.5) as a blue ray and the sold call (4) as a red ray with the expiry date the dotted green line on the right margin.
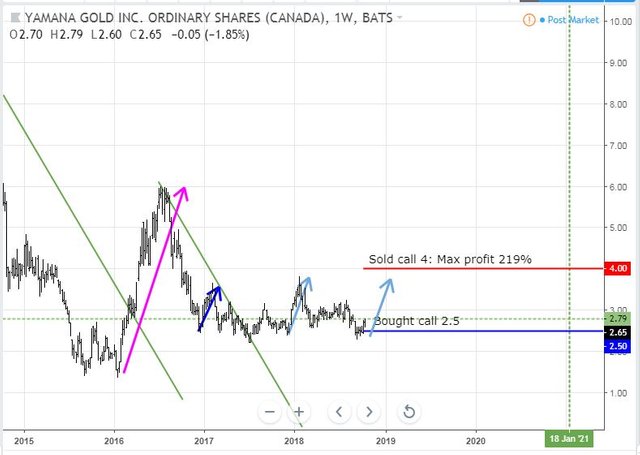
I picked that spread as the sold call is just above the recent high ($3.80 vs $4.00). Price is going to need a bit more than the light blue arrow price scenario to reach maximum profit but there are 27 months to get there. A pink arrow price move would be nice or even two dark blue arrows with a consolidation in between.
Telecom Italia S.p.A. (TIT.MI): Italian Telecom. I noticed that price has been going counter to markets during the big selloff days, especially last Friday. I averaged down my entry price.
Cloud Computing
Big selloffs provide a good opportunity to nibble away at stocks one might have missed, provided one believes that the selloff is just that - a breather rather than a warning of a collapse. I am comfortable that US GDP growth numbers have more legs - say 18 months. I am also comfortable that key cloud computing technologies will play a role in the longer term. I averaged down entry prices on two stocks and added one new position. See TIB293 for the discussion on cloud computing
salesforce.com, inc (CRM): Cloud Computing. Customer Managemenet. New position. CRM has been a strong performer in the cloud computing arena only outdone by Adobe (ADBE) and Service Now (NOW) over the last 5 years. Its price chart shows steady cycles on the uptrend testing key Fibonacci levels - two showing at 0.618 and 0.786.
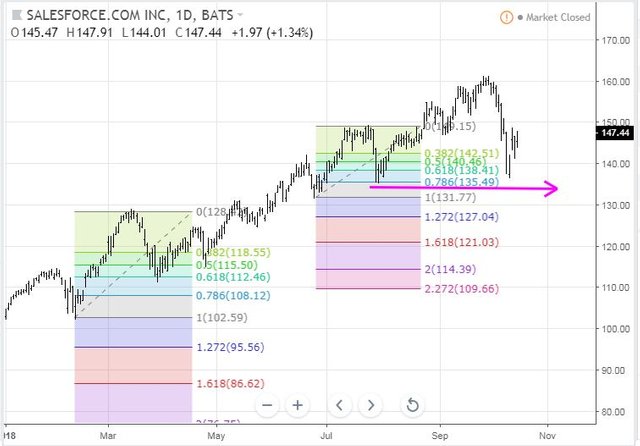
The last selloff shows price almost testing back down to prior lows but resisting it and making a higher low. That is the trigger for my entry - rejection of the pink arrow level.
VMWare (VMW): Cloud Computing. Virtualisation software. Averaged down
Workday, Inc (WDAY): Cloud Computing. Financial and working capital services. Averaged down
Harvest One Cannabis Inc (HVT.V): Canadian Marijuana. Marijuana stocks were pushed down in the last day of trading before legalization day in Canada (October 17). I added to my position in Harvest One (not averaging down but up)
eBay Inc (EBAY): Online Retail. One of the talking heads talked about eBay last week. He liked the management focus on improving competitiveness with Amazon, low price earnings multiple and double digit growth.
https://twitter.com/CNBCFastMoney/status/1049776683564392451
Two things pushed me to buy the stock. First is a little complicated. A friend of mine runs a successful business building brands to launch on Amazon. He has noticed that the Fulfilled by Amazon business is progressively being squeezed out by Amazon themselves. They are basically starting to compete directly with their best Amazon sellers. My view is this will push those sellers off Amazon onto other platforms like eBay and Walmart. Add in one more wrinkle, eBay has built strong Artificial Intelligence capability to translate offers from one language to another based on user information. Amazon is strongly focused on English speaking markets. eBay can grab sales into non-English speaking markets even though their sellers are pitching their stores in English.
Second part is the selloff has given a bit more leeway on finding an entry point. The challenge is the chart looks a bit like a falling knife since the January 2018 highs.
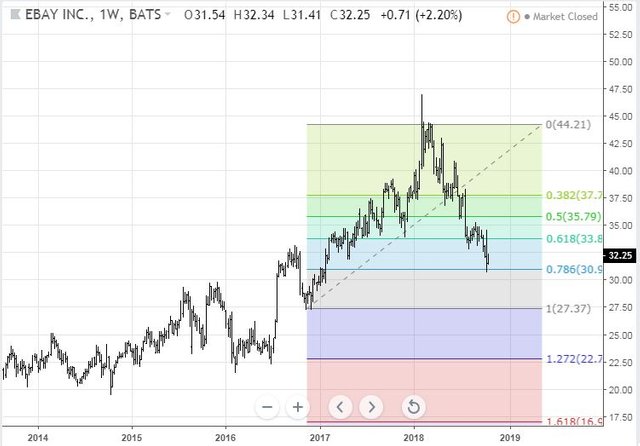
What I like is it has reached the 0.786 Fibonacci level and held there with a quite inconclusive price action last week - new high and a new low in one bar. I nibbled a small holding.
Sold
Nordstrom, Inc (JWN): US Retail. I bought Nordstrom in August 2018 because it was lagging the retail sector and I was feeling positive about the sector. In TIB278, I presented a chart comparing Nordstrom (black bars) to to the SPDR Retail ETF (XRT - orange line). At the time Nordstrom was 16% behind its sector.
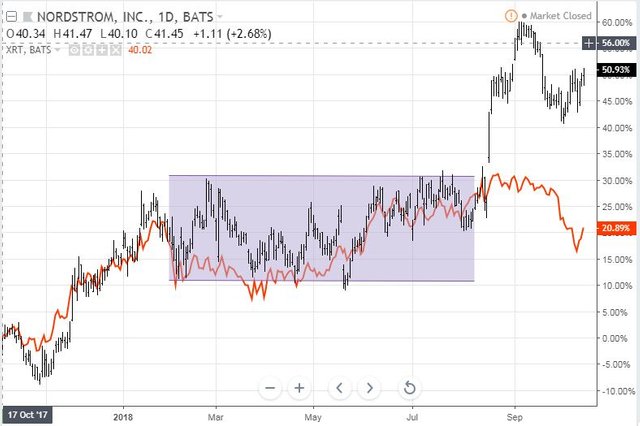
This updated chart shows this reversed with Nordstrom now 30% ahead. I closed one of my stock trades for a 19.5% profit since August 2018.
56 Percent Club
It is a bit strange presenting a 56 percent Club update after there has been a big selloff which has changed the performance profile. But I present it now as I feel there are some key pointers to what was working and could be picked up after the selloff.
Each month, I review all my portfolios and tabulate the 56 percent movers from all time and highlighting the ones from the last 12 months. I review stocks and options separately. Why 56%? A friend was spruiking an investment scheme on Facebook and asked if anybody could point to a 56% investment - yup - I have a few.
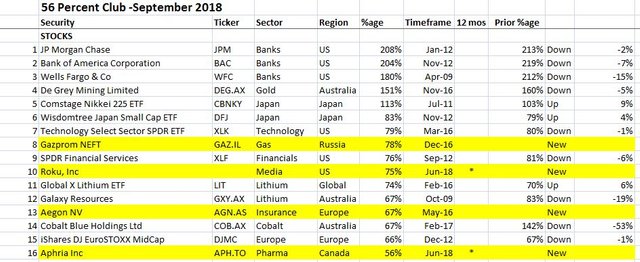
First is the table of stocks. I have highlighted ones that are new to the club in Yellow. I have also marked up whether they have gone up or down since last time.
What stands out?
- The list has same number of stocks as last time (16). There were no sales in September
- US Banks continue to dominate the top of the list with JP Morgan (JPM) replacing Bank of America (BAC) at the top. All 3 banks actually dropped in the month
- There were four new entrants, one in marijuana pharma (Aphria - APH.TO) and one in media streaming (ROKU). What is cool is both were only added to the portfolios in June 2018. The other new entrants make returns to the list - Gazprom Neft (GAZ.IL) and Aegon NV (AGN.AS). Good to see marijuana make it to the list.
- This was a weaker stocks month with 3 risers, 9 fallers and 4 new entrants.
- Biggest mover up was Japan again with the Nikkei 225 ETF rising 9% (CBNKY). Biggest faller is Australian cobalt explorer, Cobalt Blue (COB.AX). The market hates their capital expenditure needs
- Dropping off the list are 3D Printer, 3D Systems (DDD), US Banks (KBE), cobalt play, Broken Hill Prospecting (BPL.AX) and Pharma company, Amyris (AMRS)
- Resource stocks continue to slide with cobalt, lithium and gold all sliding. I can only attribute this to a rising US Dollar
- Two of the stocks were bought in the last 12 months, both in June 2018.
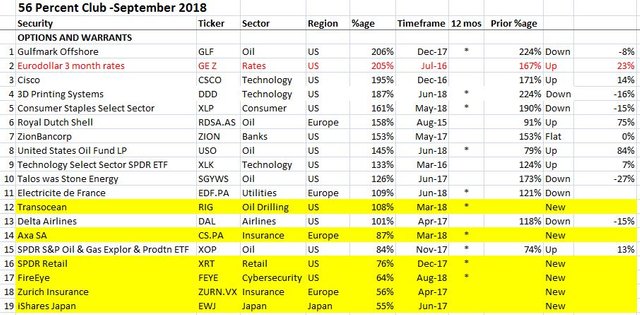
On the options side
What stands out for me:
- The list has expanded by 5 since last time (19 vs 14) with only one sale (list would have been 20).
- There is a new leader in offshore driller, Gulfmark Offshore (GLF) replacing 3D printer, 3D Systems (DDD)
- 6 new entrants in oil drilling, European Insurance, US Retail, Cybersecurity and Japan. All of these have been on the list before.
- Dropped off the list is Swiss pharma company, Novartis (NOVN.VX) which I sold in-the-money options.
- Oil stocks still hold their sway with 6 out of 19 holdings in oil (was 5).
- Fastest riser is United States Oil (USO) Fund rising 84%.
- The notable riser this month is the US Retail sector - so much for thinking retail was dead. People do shop when they have cash.
- 8 out of 19 positions were bought in the last 12 months.
- 6 risers, 7 fallers/flat and 6 new.
Cryptocurency
Bitcoin (BTCUSD): Price range for the 13 day period was $701 (10.4% of the high). Price basically traded between the two short term levels (the pink rays) the whole time even on the day of the crazy spike price on the Tether rumours.
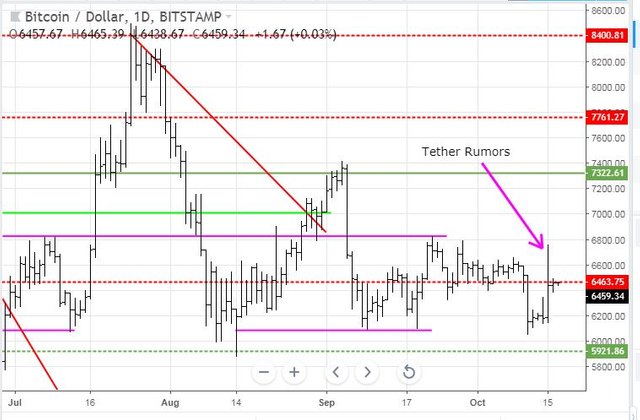
Do not be surprised to see this range hold for some time.
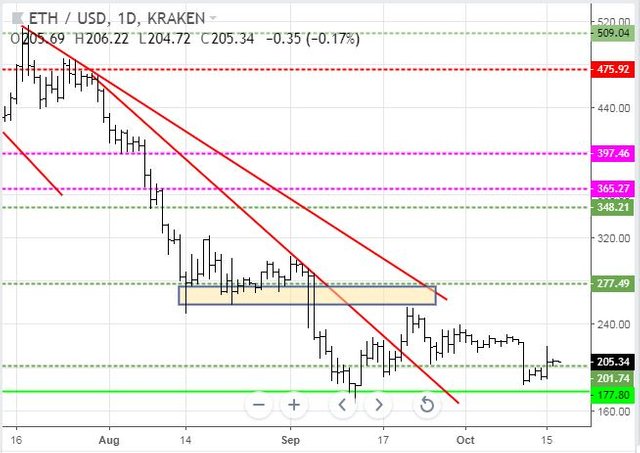
Ethereum (ETHUSD): Price range for the 13 day period was $46 (20% of the high). Price drifted lower and had one collapse to make a lower low and recovered from the lower support level around $200. If price holds the lower dotted green support level, it could well move ahead to test $250.
CryptoBots
Outsourced Bot No closed trades in last 13 days. (221 closed trades). Problem children stayed at 18 coins. (>10% down) - ETH (-69%), ZEC (-67%), DASH (-67%), LTC (-51%), BTS (-51%), ICX (-77%), ADA (-71%), PPT (-81%), DGD (-79%), GAS (-83%), SNT (-59%), STRAT (-75%), NEO (-81%), ETC (-58%), QTUM (-79%), BTG (-72%), XMR (-39%), OMG (-70%).
One new trade was opened on BTS. Most coins dropped 1 to 3 points = not bad for 13 days. LTC (-51%), BTS (-51%), ADA (-71%), NEO (-81%), OMG (-70%) all dropped a level. Worst faller was ETC dropping 6 points.
DGD (-79%) did improve one level and GAS (-83%) remains the worst.
Profit Trailer Bot Quite a lot of action in this account including some bot problems which crashed the VPS = not good. I will update details in next post.
New Trading Bot Trading out using Crypto Prophecy. All trades closed in profit. I will update in next post.
Currency Trades
Forex Robot closed 6 trades in the last 2 days only (0.23% profit) and is trading at a negative equity level of 31.5% (lower than prior 40.2%). This high negative equity situation dragged the account into a negative margin position.
This also complicated the account status. The account is located in the European Union which just introduced new leverage rules for retail investors. Basically, the faceless bureaucrats have started to regulate for the lowest common denominator and assume that all retail investors are basically stupid (though some undoubtedly are). It was possible for me to change over to professional investor status with some sharing of asset and trading information. The price is I lose all protections even if the broker turns out to be a problem. I hate this sort of unintended consequences of well meaning regulation.
Outsourced MAM account Actions to Wealth closed out 14 trades for 0.76% profits for the period. Of the 14 closed trades only 2 were losing trades.
Cautions: This is not financial advice. You need to consider your own financial position and take your own advice before you follow any of my ideas
Images: I own the rights to use and edit the Buy Sell image. News headlines come from Google Search. All other images are created using my various trading and charting platforms. They are all my own work
Tickers: I monitor my portfolios using Yahoo Finance. The ticker symbols used are Yahoo Finance tickers
Charts: http://mymark.mx/TradingView - this is a free charting package. I have a Pro subscription to get access to real time forex prices
October 15-16, 2018
work is very awesome,i agree your works sir @carrinm
Great to see you back! Discipline is the toughest behavior to persist with when investing! I actually took advantage of the sell off to get out some of the puts and shorts I had on. Could not breakeven but was able to get some funds in for my next move.
It is indeed. Sadly I had my eyes off the ball on the October SPY Put spreads I have. I was thinking that expiry on the puts was not until next Friday. Oops!! I could have exited last Friday at breakeven especially if I left the sold put in place. Not to be. I might get lucky if we get another down day to extract some value before end of day Friday. BUT that is what hedging trades are for - to hedge positions and not to crate winners.
Awesome transparency...I continue to learn a lot from your posts.
PS - I was trading the NQ futures and loving the volatility.
Thanks. Good to hear. I learn too.
I was just thinking today about futures trading especially if one can find a mini form that has reasonable contract sizes. I have some long corn futures that have bounced and producing great profits relative to the margin I have to hold.
Hallo @carrinm, i like your performance, please follow me, i will share your post..
not another word for you @carrinm, keep on being passionate and successful always, I always support you ..