Activity at Some of the Decentralized Exchanges...
https://www.stateofthedapps.com is a rather interesting website that can give us an inside look at some Decentralized Exchange activity.
Recently, I ran across this website. Full Disclosure: I don't know anything more about it. (I don't know who built it nor have I tried to independently verify the data.) And was rather impressed with the data it has.
So one of the problems with blockchain projects and exchanges is that user activity is often cloaked, making it difficult to know what is going on. Here they pull out active users in the last 24 hours from the blockchain. And they have numbers for several big Crypto projects.
The website includes non-exchange projects. For example it shows Steem-it.
It shows Steemit with about 6,000 active users over a 24 hour period. This seems reasonable to me. If there is anyone out there with better data... let me know in the comments. Steemit has a market cap of $161 million with 6,000 active users a day. That means means an active user is worth $26,000.
We can also see several dice games and games are the top De-centralized apps.
This seems to make sense...
Looking at exchanges we see the following.
NewDex ..... 2,216 users,
Idex ..... 685 users
ForkDelta .... 644 users
Ox ........... 542 users
DexEOS ...... 448 users
Loopring .... 406 users
WhaleEx ...... 287 users
Bancor ....... 287 users
KyberNetwork ......239 users
The Token Store .....188 users
Augur .......................167 users
I have heard a lot about the Bancor protocol. I read the white paper. It all sounded good but I never joined or traded there. Here we get some indication of usage. I see are several listings for Bancor, so it might be more complicated.
I have looked at both NewDex and Idex in the past.
So 0x is the 33rd largest crypto currency project. It has a market cap of $175 million. With 542 users, each user is worth about $300,000.
Loopring is rank 60th, with a market cap of $70 million. With 406 active users each user is worth $172,000.
Bancor is ranked 99th with a market cap of $33 million. With 287 users each user is worth $114,000.
Kyber is ranked 135 with a market cap of $22 million, each of the 239 users are with $92,000.
Augur is ranked 34th with a market cap a $162, each daily user is worth about a million dollars.
Idex, -which has a couple of tokens- is confusing me.
There are some major projects not listed. BitShares Dex, if it was listed I think we be near the top of the list with thousands of active users a day. Somewhere between Steemit and NewDex. (Last summer I had estimated BTS with 12,000 active users over two days. I know activity has fallen since then. I am not exactly sure where it is at now.)
I also do not see Waves. I have previously looked at Waves and it generally appeared to have volume at about 1/2 to 2/3rd the level of BitShares.
Several Times I have looked at Augur -This is a gambling market/prediction market. While a neat idea, there was not much activity on the contracts. Again, it is an "interesting project", but "interesting projects" need "real users" to take off.
Augur currently las a market cap of 161 million. Is a project that has 167 users a day worth a market cap $161 million? I do not consider "a daily user" worth 1 million dollars.
Several of the other exchanges, I have not really heard much about.
There are lots of different ways to value projects, with social and trading apps, "people" are part of the value. It is real easy to set up any projects with hundreds, thousands, and tens of thousands of users. One simple writes a computer program to create extra "accounts." One could write a program to create 1 million, 1 billion or 1 trillion accounts. The value is not in accounts, it is in real people who are using the services, and what those services are. The more people that come to an event, the better off it is for everyone. In order for markets to be a success, there needs to be both buyers and sellers. In a crowded space, it can be hard to create and build a brand and get and keep users. People can also come, trade and leave. Keeping users and users engaged is hard. Because of all of this, users in the last 24 hours is a good metric to use to look at various projects. It can be hard to find some of that data, and I take all data with some salt and compare it to other data to confirm what is going on.
One can also click and get a little more info about each of these on the site:
IDEX
Bancor
LoopRing...
Idex...
However you want to look at the numbers, I think there may be a goldmine of information at this state of the Dapps website. Someone did a good job putting these numbers together. I thought I should share, so other can use the resource.
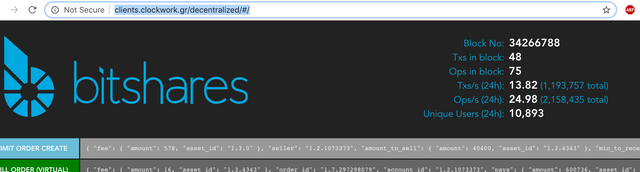
BitShares Active Daily Users:
http://clients.clockwork.gr/decentralized/#/
Wow. Thanks for the link. Fantastic.
That looks like an easier place to get the number than I have gotten it before.
There was 10,893....
So a day later there is 15,429. I think this "users active within the last 24 hours" is a very good metric to track. This metric, is counted a little different than I have counted it in the past. I expect this metric to be bigger, and probably by 20 to 50%. That said, this number is available, quickly and easily, and I like the availability of the metric. One of the big values in numbers like this is tracking trends, that gives a historical baseline and shows the variability and increase and decrease in activity. This is just one metric, but a good one.
it's basically distinct accounts that have submitted a TX in the last 24 hrs...
Queried from my ES node
13, 928 Cool. Is there any way you might be able to easily archive this number daily on a web page, and/or create a chart? For the long term, I think it would be helpful to see if this activity is increasing or decreasing, on a week to week, and month to month basis. While sampling it on occasion, what I am doing now, works, having more detail, using averages to get rid of volatility provide additional value and clarity. I also think numbers like this are crucial to getting people to the Dex long term. We need to know where we are at, and what direction we are headed. We need to know if what we are doing is working and some way to track results. I also think we need to know why people come, and what they are doing. There are also a lot of exaggerated or misunderstood numbers floating around. I have been trying to dispel some of them with truth. There also needs to be conversation publicly, about usage, strategy and numbers. Where are we at, where are we going. Now I have done posts on this from time to time, and I use lots of different metrics, -as multiple metrics are critical to understanding anything. All that said, the first step is getting good clear, data. I really like this metric. If it would be possible to save and archive it someway so it can be easily analyzed later, that would be great.
11,988
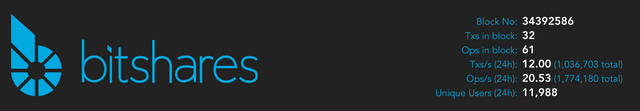
I think usage is down because of global settlement. Once that is taken care of it should pick up.
I agree, global settle is not helping and the overall doldrums of the crypto market are not helping either.
I actually just found another great source. This has cryptobridge (which is all on BitShares). https://www.blockchaintransparency.org/december-2018-rankings
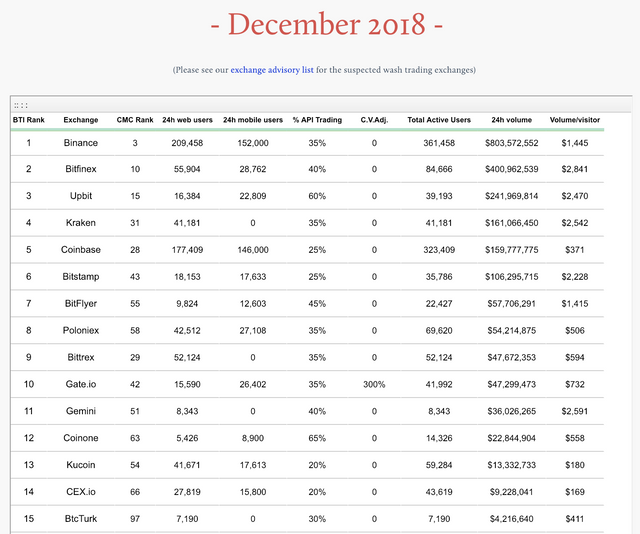
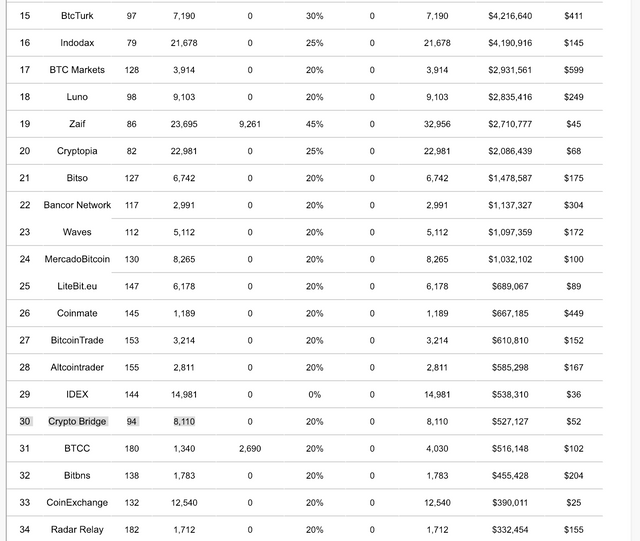
It would appear that total users and 24 hour active users are the same for a lot of the smaller exchanges, but this is still a great resource to say, this exchange is bigger, or more active than another exchange. For Example, While I compared BitShares and Waves and found BitShares to be bigger, here he see that is confirmed, waves is 5/8ths the size of BitShares(CryptoBridge). We also see Bancor is 1/4 the size of BitShares, and Kyber is on the small side. I really like it when I have multiple independent data sets telling me the same thing as far as size and volume of certain exchanges.
Congratulations @cryptick! You have completed the following achievement on the Steem blockchain and have been rewarded with new badge(s) :
Click here to view your Board
If you no longer want to receive notifications, reply to this comment with the word
STOPTo support your work, I also upvoted your post!
My how things change...
