3 Amazing things we can now do with Satellites #3
In my current work at the European Space Agency, I work to help foster innovation around the use of satellite data. It is an exciting area that is currently seeing explosive growth. This both due to companies like SpaceX providing cheaper access to space, but more so due to advancements in computer science. The true potential of satellite imagery is only unlocked now thanks to Big Data analytics, cloud computing, and machine learning algorithms. Moving us from interpreting still-images, to using the continuous flow of image data as input to produce new services.
Here are some examples of exciting new applications that are both cool and disruptive:
Detecting new Building projects
German StartUp company, Building Radar, make use of satellite imagery to autonomously identify and document new construction projects worldwide. This information is then used, together with secondary data sets, to provide an update date database on the existence and status of new building projects, where they are and what they’re for. This is then sold as a service to their subscribers. Some interesting use-cases are for companies selling furniture’s or other interiors usually bought at a later stage in the building process. These may then move ahead of their competitors to market their products to those that are building the new buildings. Building Radar also provides market intelligence on more than 1 million construction projects to other stakeholders who are interested in real estate prices, economic growth of different regions, etc.
aerial image of an early-stage construction site source
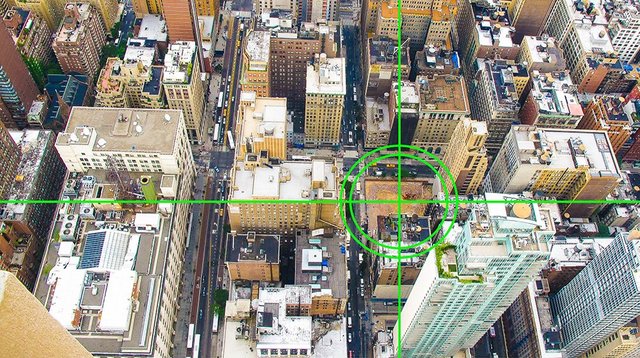
From space, it is easy to separate bare soil from other buildings. Machine learning algorithms can easily learn to distinguish between a rooftop and bare soil. Radar satellites can then tell whether construction work has begun, based on changes in elevation of the ground. By monitoring these changes, the database knows where construction projects are about to begin and can look up further information from secondary sources about the project plans for the address and who is looking to move in once it’s completed.
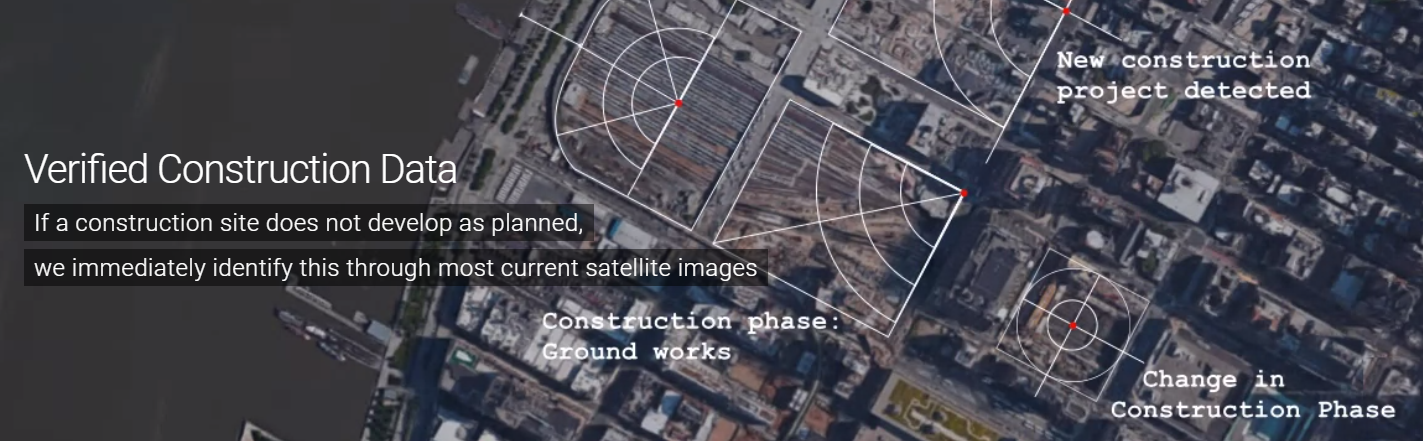
Construction projects are continuously monitored with satellite images.
Image from Building Radar’s website
I really like this example because it is both an outside the box way of integrating satellite data in a digital service, while also addressing a huge non-space market.
Optimising Shipping routes in frozen waters
One major application of satellites is the monitoring of the state of the global environment. This includes waters, forests and glaciers among other things. To monitor and measure the thickness of ice-sheets and glaciers, radar satellites are often used. This is mostly used to keep an eye on the arctic ice levels, and other glaciers to monitor the rate and effects of climate change. One new innovative application of the same datasets and analytics is the monitoring winter ice in the Baltic sea.
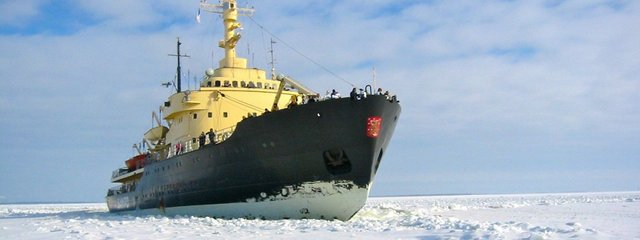
Ice breaker in the Baltic sea. source
For countries such as Finland, where more than 75% of imports and over 80% of exports go via sea, allowing ships to enter and exit the ports also during winter is of key importance to the economy. Especially since Finland is the only country in the world where all ports regularly freeze during the winter. This also applies to other Baltic countries, although to a lesser extent. To handle this, the countries deploy a fleet of ice-breaking ships. As you can imagine, breaking up hundreds of kilometres of ice, and keeping it open regularly throughout the winter, is no small task. Anything that can help improve efficiency can quickly save millions of dollars per year. This is where satellite data is useful. The ice-breaker ships and the mission control centres are equipped with frequently updated maps on the state of ice on a regular basis. Based on this knowledge, they can choose the optimal paths based on where the ice is thinner, and may also deploy their ships only when it’s needed.
As can be seen in the image to the right (source), the entire Finnish coast was covered by ice, seen as grey, during the winter in 2012/2013. The red lines show the two longest distances from the open waters and back to the mainland, where the red line to the right leads to St. Petersburg in Russia. According to an analysis published by EARSC, the European Association of Remote Sensing Companies, the use of these radar-images has resulted in gains and savings of between €24m and €116m per annum in Finnish and Swedish economies source.
Optimising placement of solar panels
Solar power has become increasingly relevant in recent years thanks to a drastic reduction in solar panel costs. However, just because the panels are cheaper doesn’t mean that it’s profitable to use anywhere in the world. Whether or not it will be profitable to install depends on a lot of variables such as how many hours per day the panels will be exposed to sunlight and how much exposure differs throughout the year (since energy prices tend to vary a lot throughout the season). As a result, solid information on the surface exposure can be very valuable when deciding whether or not to invest in solar panels, and where to place them in order to maximize their production of electricity.
Here, satellite data provides a unique advantage. Thanks to their consistent revisit time over the same position on the ground, they can produce information on average irradiance. Thanks to the Meteosat and GOES satellites, we have data on surface irradiation going back decades. Compiling these data sets allow us to produce what’s called a Global Horizontal Irradiance (GHI) map seen below.
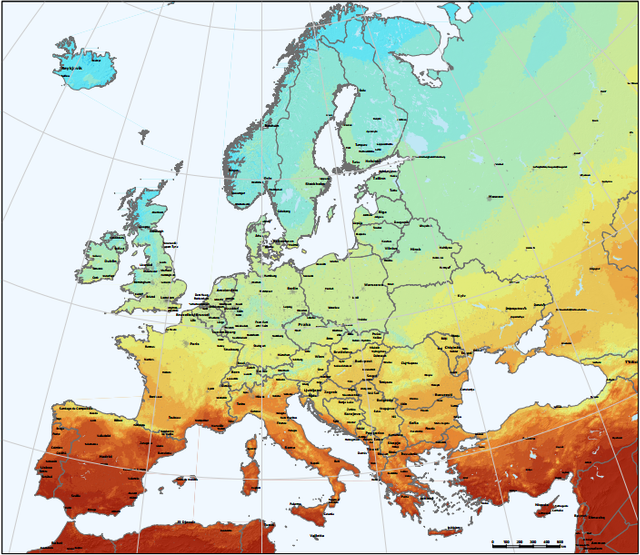
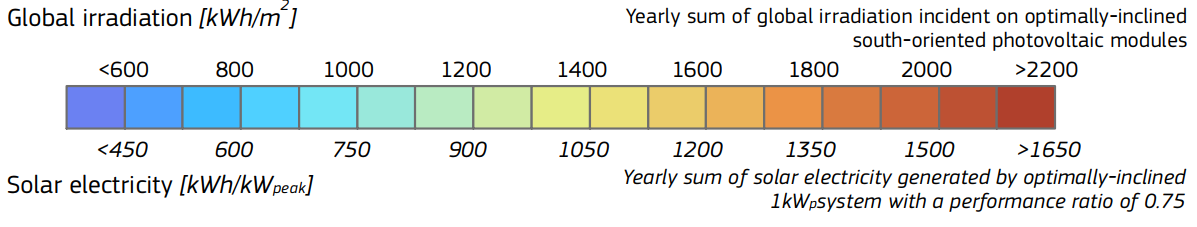
Image of Photovoltaic Solar Electricity Potential in European Countries
Image credit: PVGIS @ European Union source
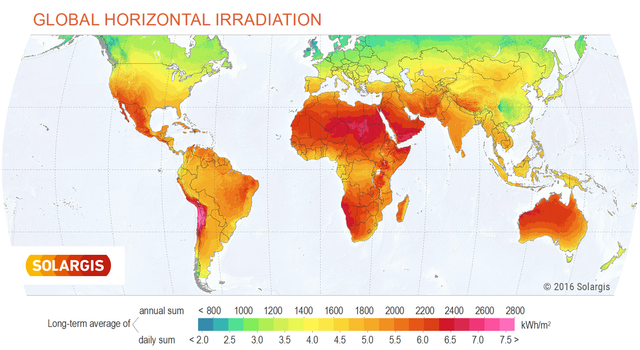
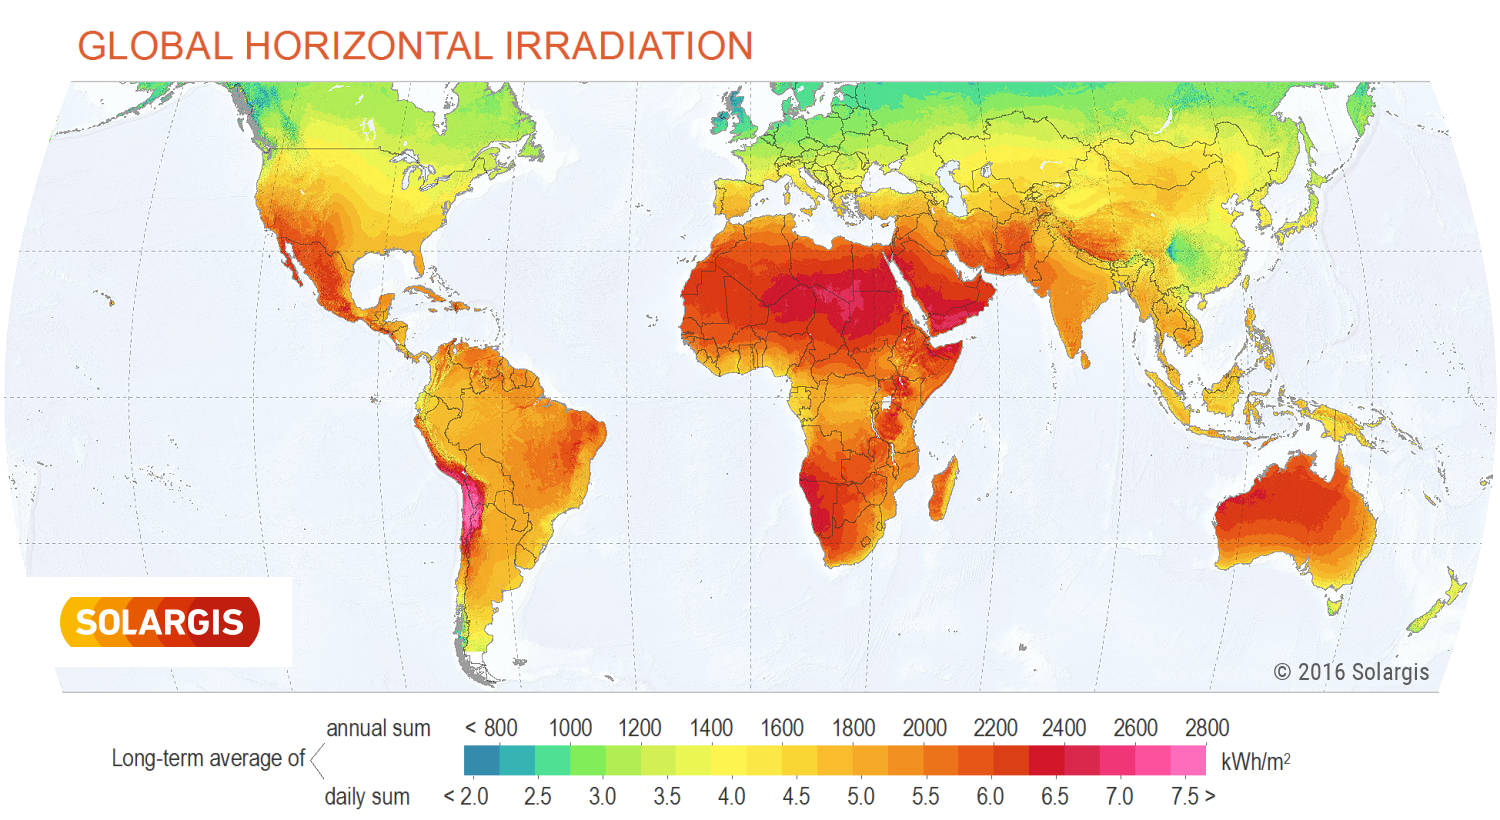
Image of Photovoltaic Solar Electricity Potential World-wide
Image credit: SolarGIS, source
With newer earth observing satellites with higher resolution, satellite images can also be used for more local decision-making. With the resolution provided by Copernicus Sentinel 2 or PlanetLabs, it is also possible to observe what surfaces see more sunlight than others. Ground that is illuminated by light can be easily distinguished from the ground that falls within a shadow. Compiling several satellite images of an area thus allows us to know which surface areas see the most sunlight throughout the year.
On top of this, satellite images can also tell the dimensions and angles of roofs. Since the computer knows what direction is north versus south, it can then tell which side of the roof will see the greatest number of sun-hours, and calculate their efficiency based on their angle towards the sun at peak-times. As solar panels are getting more popular for homes, installation companies allow potential buyers to enter their address into a search bar and receive detailed information about how much energy they can expect to produce per month, and how much that will save them on their electricity bill.

Deciding on the right location and angles for solar panels can greatly affect their production levels
Want to try processing new satellite images yourself?
Today, huge amounts of data are made freely available through the Copernicus programme run by the European Commission and the European Space Agency. You can download the raw data from their satellite constellation yourself for free here, which can be processed professionally by the free and open source tool snap here.
Did you find this information fascinating? Make sure to Follow me for more and check out my Beautiful Satellite Images of our Planet you won’t believe are real where part #4 will be online later this week!
Steem on!
Fredrik / @fredrikaa
Resteemed. Thank you for the post, @fredrikaa. As an aspiring space entrepreneur, your posts have provided a lot of value for me. Looking forward to reading more exciting stuff from your end.
You're very welcome! Helping to inform people who can make use of satellite data in new product development is also part of my job after all. And helping to inspire a new Apollo-era level of enthusiasm for space and science is my big dream :)
Happy to have you here and to be following you myself! Thanks for the resteem and take care :)
I've heard about how we are mapping the new routes of travel in the north of Canada to reach Europe faster than using the Panama channel. Super exciting stuff.
Yep! As a Norwegian myself I've witnessed directly how we monitor the Northern sea and the Arctic with satellite imagery. If climate change continues at the current rate then the fastest travel route from Europe to China and Japan will be up and along the Norwegian coast and past the Arctic there. Making yet another potential big use-case for the technologies (although we'll hopefully not get there).
I already invested in a company for Arctic travel routes. I think the damage to the environment is far too big to do something at the moment. Maybe 10 or 20 years tops till it is profitable. I hope I'm wrong and I lose my money.
Haha, you sound like my friend who used to bet on his favourite football-team losing the game. So that he would either be happy for his team, or happy for his money.
Først og fremst fantastisk jobb med denne artikkelen @fredrikaa! Hello from Latvia (one of the Baltic states). I guess when I thought of ice monitoring before, it was more for glaciers and scientific purposes, but of course ice affects economies as well. Thank you for sharing your more spacey stuff. I enjoyed.
Did you start in Norwegian and then change your mind? :P
Yes as mentioned the techniques were initially developed to monitor the Glaciers and the Arctic, but clever people soon enough find other applications :)
Glad you liked the article!
@fredrikaa yes, it's been a while I've used my Norwegian, I am shy. Hihi. Can't wait for your next article already.
Some fantastic information here. Thanks!
Satellite images keep on updating after a regular interval but here in my country India, the situation is not very good. Sometimes on google earth it is still showing forests whereas the construction has been completed there and apartments are made, so how reliable these data are is still a question in many countries like India. Although this technology is revolutionary here we not benefitted by it.
Data is there, public access via free services maybe it is not that easy in all the countries and the availability is there, but under licensing, so this problem is a Google problem itself.
Anyway, the Copernicus program of the European Space Agency offers free imagery, and their cameras don't stop sensing anywhere, so India is covered. You don't have borders at space (somehow).
You can find the Copernicus images at the link @fredrikaa has posted at the end of the post to the SciHub, look for Sentinel-2 and Sentinel-3 images for visual optic imagery. If you are interested in ocean data you can enter Eumetsat CODA and retrieve data from Sentinel-3.
If you want to play a bit with a viewer/marketplace you can use Geocento or the NASA Worldview for derived information
Other companies offer services with more images, most of the times paying but sometimes with a free testing period
Google Earth is made of very high-resolution images that are purchased at very high prices. The frequently updated images which will detect those changes are not shown in Google Earth.
That is the same anywhere in the world. If you want to see recently taken images you should either try the link I provided at the end, or the online tool EO Browser access and quality is the same no matter where you are in the world.
Thanx for giving me much detailed info about other programs.
Congratulations @fredrikaa! You have completed some achievement on Steemit and have been rewarded with new badge(s) :
Click on any badge to view your own Board of Honor on SteemitBoard.
For more information about SteemitBoard, click here
If you no longer want to receive notifications, reply to this comment with the word
STOPVery interesting article, thanks! We don't really know what is moving above our heads everyday, but it is obviously useful. Resteemed too.
Well written and interesting post! Great to learn more about the use of satellite images